> For the complete documentation index, see [llms.txt](https://docs.buzzy.buzz/llms.txt). Markdown versions of documentation pages are available by appending `.md` to page URLs; this page is available as [Markdown](https://docs.buzzy.buzz/getting-started-with-buzzy/new-buzzy-ai-v3/5.-editing-your-app-in-the-design-tab.md).
# 5. Editing your app in the Design Tab
The Design tab is where you make direct screen-level changes in the editor. It supports both AI-assisted changes and manual editing, so you can move quickly between prompting, selecting, inspecting, and adjusting the layout.
## Make changes with AI from the Design tab
1. Open **Build** > **Design**.
2. Choose the screen you want to change from the screen picker above the preview.
3. Open the **AI** panel from the top-right toolbar if it is not already visible.
4. Enter a prompt describing the change you want, such as "Add a search bar at the top", "Change this list to a two-column grid", or "Add an export button below the table".
The AI updates the selected screen based on your instruction. Review the result in the preview before moving on.
You can collapse the navigation and chat panels when you want more room to inspect the screen.
## Make manual changes in Edit mode
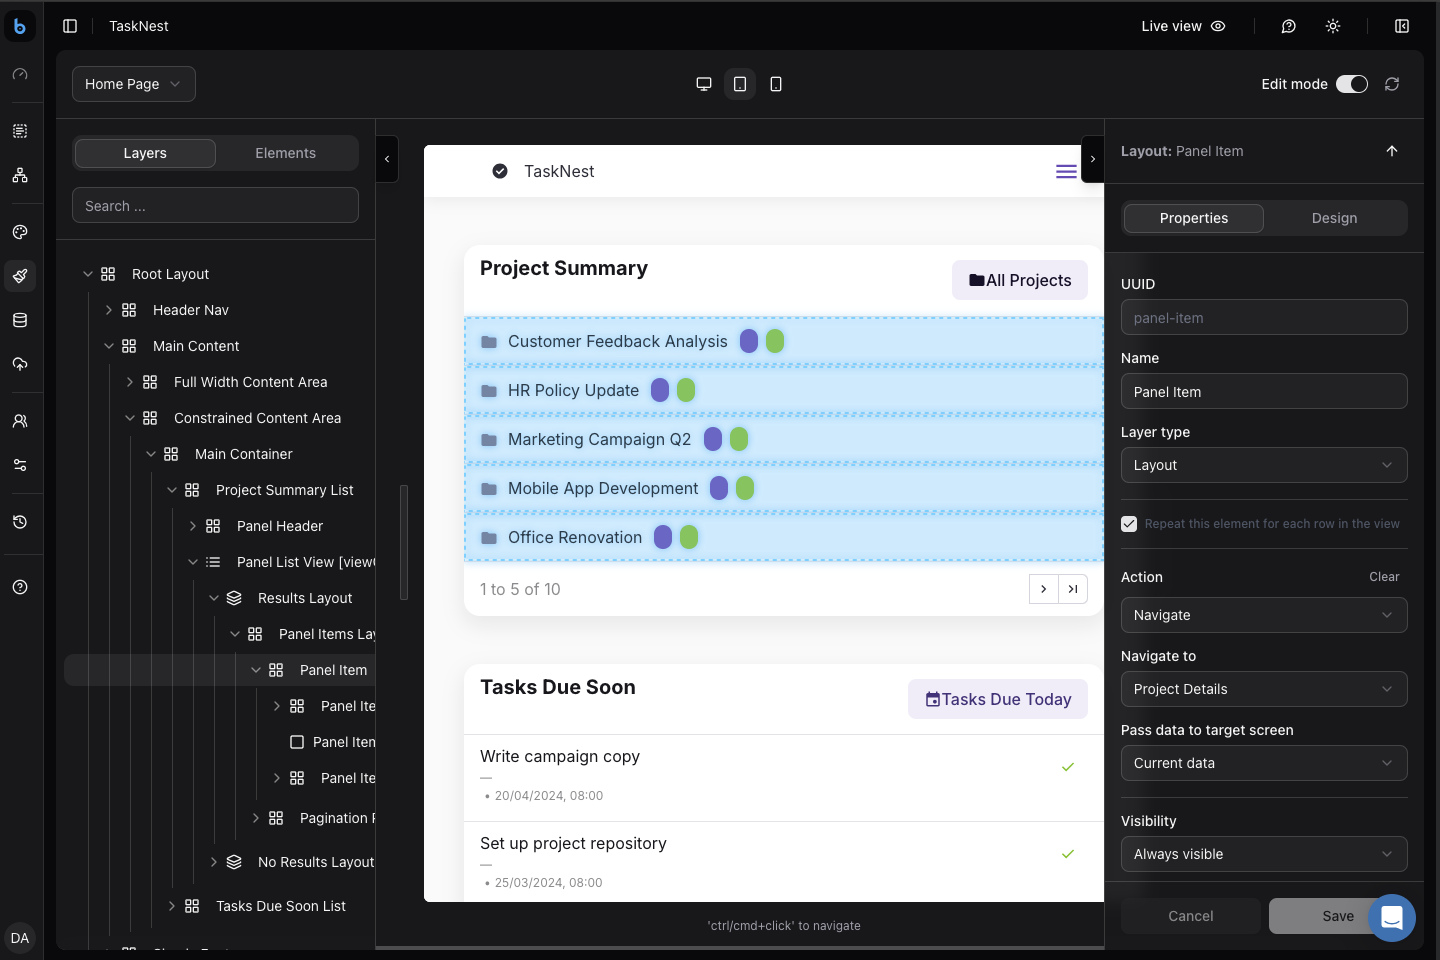
1. With the correct screen open, switch the preview to **Edit** mode.
2. Select an item directly in the preview or from the left-hand structure panel.
3. Use the right-hand tabs to inspect and edit the selection:
* **Properties** for labels, layout, actions, bindings, and display settings
* **Code** when a selected element exposes editable code-backed configuration
* **Debug** when you want to inspect bindings, context, and issues before changing anything
> 💡 Tip: You can mix manual edits, AI edits, and debug diagnosis in the same session.
## Insert components from Assets
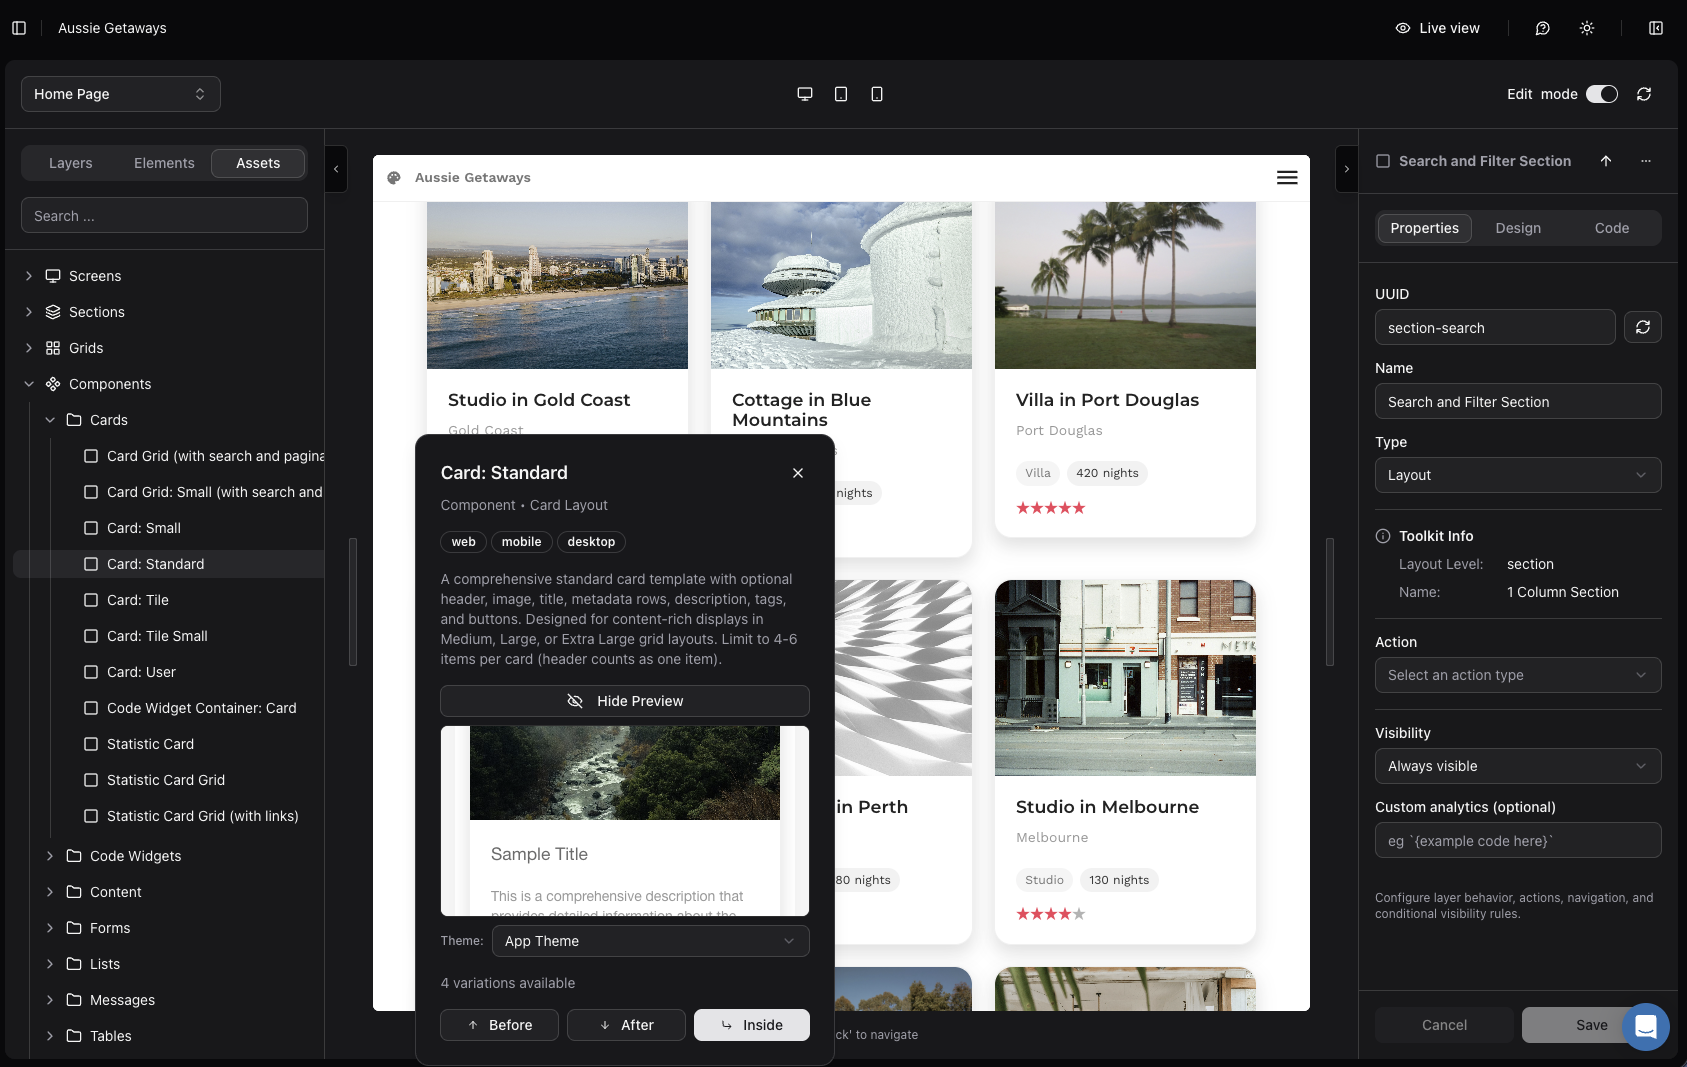
1. Open **Design** and switch the preview to **Edit** mode.
2. Select the area or component where you want to insert something new.
3. Open the **Assets** tab in the left panel.
4. Browse or search the available Buzzy components.
5. Preview the asset if needed.
6. Choose **Before**, **After**, or **Inside** to insert it relative to the current selection.
## Diagnose a problem before editing
If a component looks wrong, open the **Debug** tab before you start making changes. This is especially useful for:
* broken data bindings
* visibility or display-rule issues
* repeated content such as lists and sub-tables
* actions that appear to be wired incorrectly
From the Debug tab, you can inspect the issue list and launch **Diagnose with AI** for the current selection or screen.
For the full debug workflow, see [Debugging with the Debug Tab and Debug Agent](/getting-started-with-buzzy/new-buzzy-ai-v3/6.-debugging-with-the-debug-tab-and-agent.md).
***
For more examples and help, visit the [Buzzy AI Prompt Guide](https://docs.buzzy.buzz/getting-started-with-buzzy/buzzy-ai/example-prompts).