> For the complete documentation index, see [llms.txt](https://docs.buzzy.buzz/llms.txt). Markdown versions of documentation pages are available by appending `.md` to page URLs; this page is available as [Markdown](https://docs.buzzy.buzz/getting-started-with-buzzy/new-buzzy-ai-v3/6.-debugging-with-the-debug-tab-and-agent.md).

# 6. Debugging with the Debug Tab and Debug Agent

The Buzzy editor includes a built-in debugging workflow for screens, components, and data bindings. You can use it to spot problems visually, understand what is selected, ask AI for a diagnosis, and apply targeted fixes without leaving the editor.

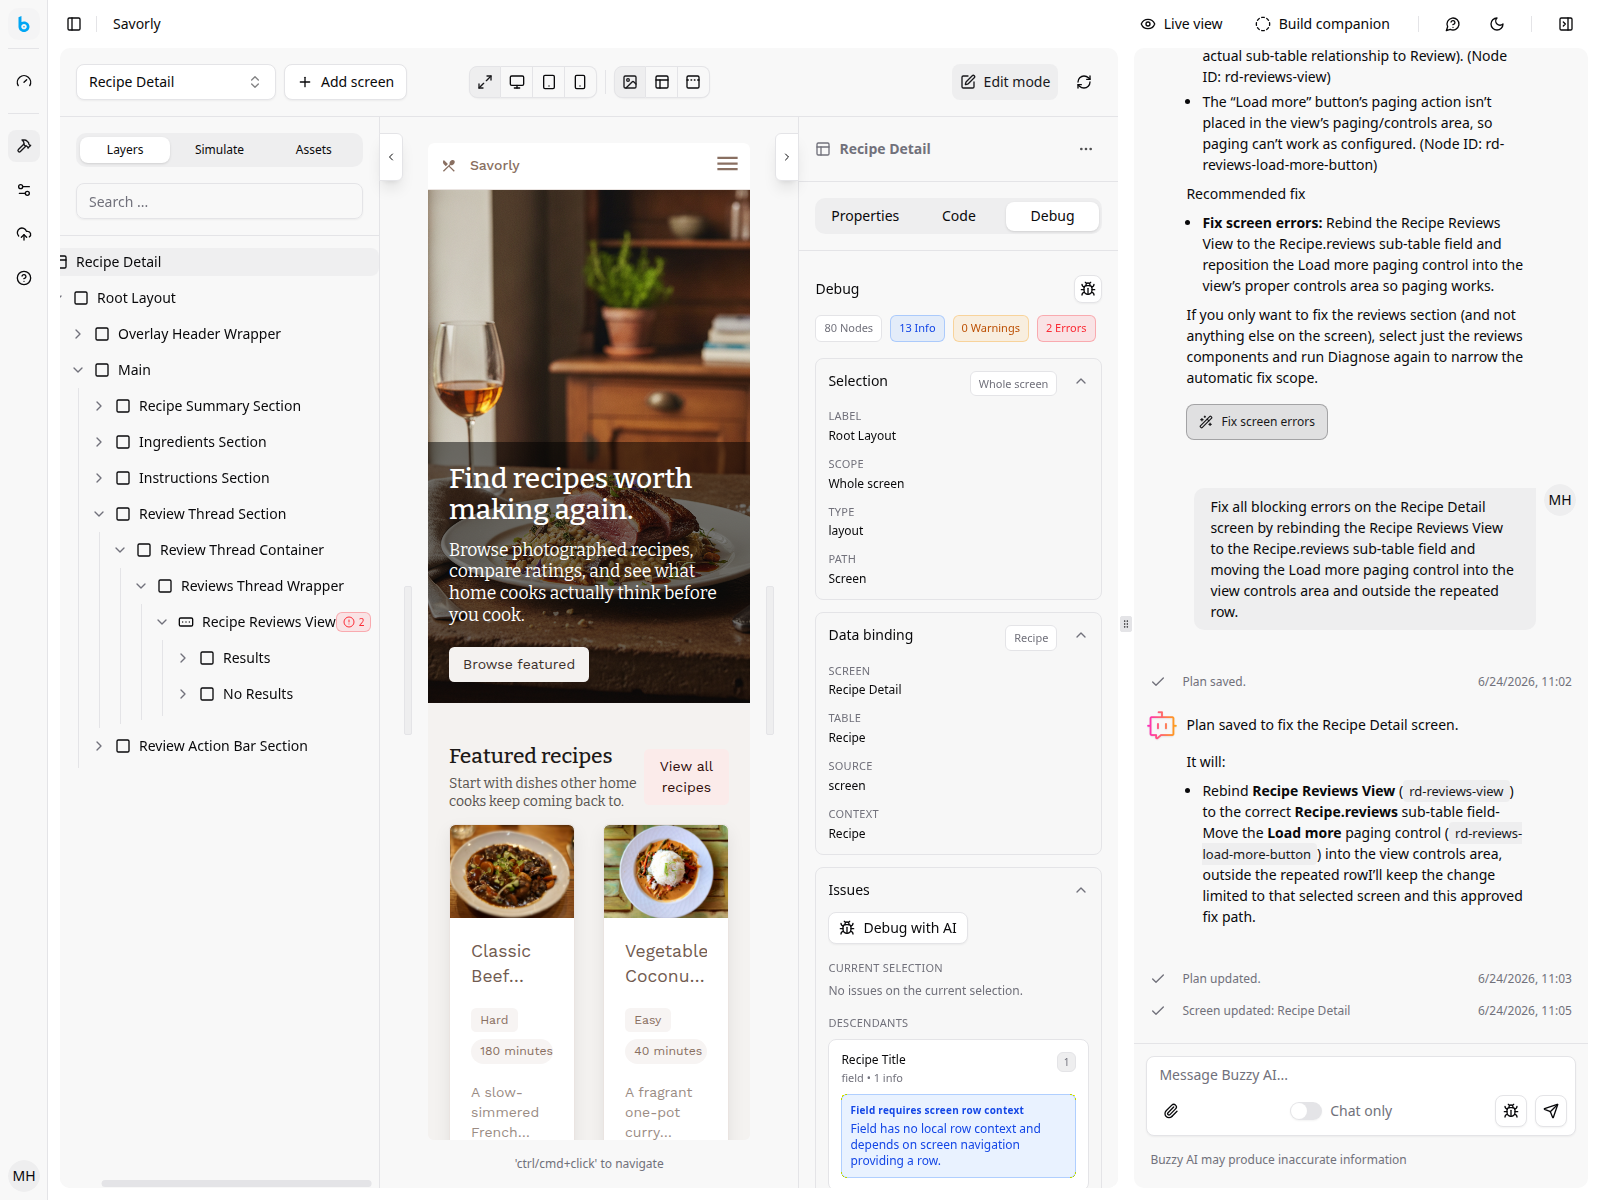
<figure><img src="/files/AwDQ0WHZS2zwHoUpdU2T" alt="Buzzy workspace editor showing the preview, left navigation, AI chat panel, and the right-hand Debug tab."><figcaption><p>The Debug workflow lives inside the editor, alongside the normal design and AI tools.</p></figcaption></figure>

## What these tools are for

Use the **Debug** tab when you want structured, contextual information about the current screen or selected node. Use the debug agent when you want help interpreting those signals, narrowing the problem, or generating a safe autofix.

In practice, the workflow is:

1. Select the screen or component that seems wrong.
2. Open the **Debug** tab to inspect issue counts, bindings, and context.
3. Launch diagnosis from the Debug tab or the AI chat.
4. Review the diagnosis and apply an autofix if the recommendation matches what you want.
5. Re-check the screen after the change.

## Debug tab vs debug agent

Use the **Debug** tab when you need:

* a quick read of the current selection
* issue counts for the selected node or full screen
* data-binding details
* runtime context such as row data, table fields, visibility, or display information

Use the **debug agent** when you need:

* help understanding what the issues mean
* a plain-language summary of what is broken
* a recommended fix strategy
* an autofix for a clearly scoped problem

## Diagnose the current selection

1. Open **Build** > **Design** and choose the screen you want to inspect.
2. Switch the preview to **Edit** mode.
3. Click the exact item that looks wrong in the preview or select it from the left panel.
4. Open the **Debug** tab in the right-hand panel.
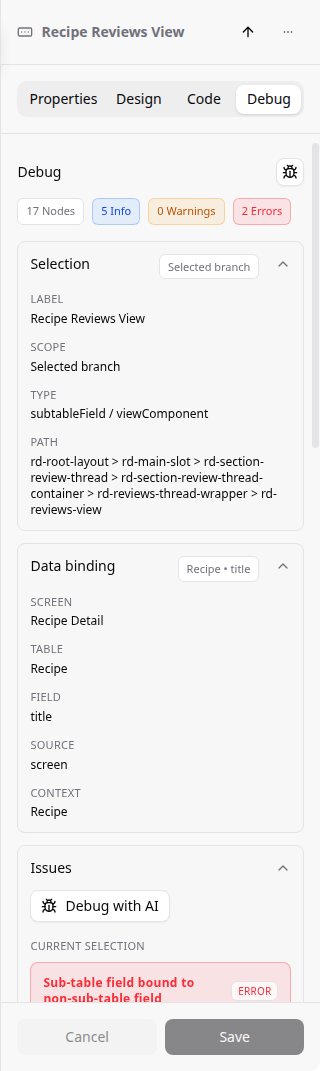
5. Review the selection summary, binding details, and issue list.
6. Click **Diagnose with AI** if you want Buzzy to explain the problem and suggest a fix.

<figure><img src="/files/64cyNRpmMqKNrx3RsUkj" alt="Debug tab focused on a selected review component, showing issue counts, the current selection section, and a Diagnose with AI button."><figcaption><p>Selection-level diagnosis is the fastest way to investigate one broken control or binding.</p></figcaption></figure>

Selection scope also affects the fix packages Buzzy can offer. If you select a single component or branch first, Buzzy can keep the repair focused on that area instead of proposing a broader screen cleanup.

## Diagnose the current screen

Sometimes the issue is broader than one component. In that case, click the screen itself in the left panel or clear the selection until the screen is the active context, then open **Debug** again.

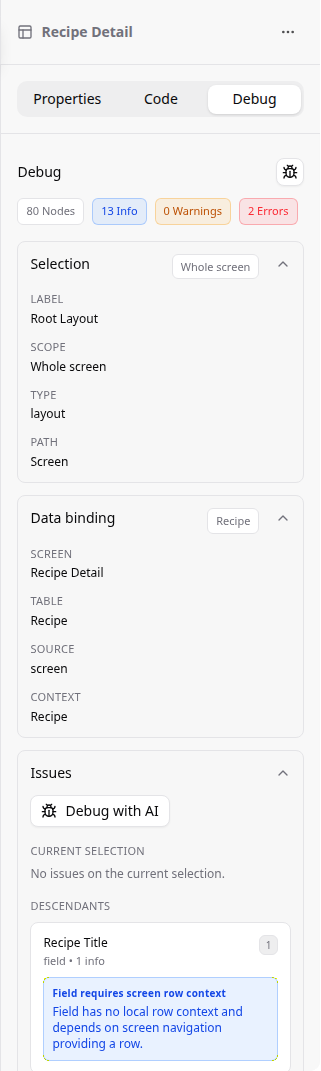
At screen scope, Buzzy shows:

* the total node count for the screen
* the number of info, warning, and error items in scope
* issues on the current screen
* descendant issues for child nodes deeper in the layout

You can click a descendant issue to jump directly to the affected node.

<figure><img src="/files/O0U2Ep27jVa9d3w7JJ0d" alt="Debug tab showing screen-level issue counts and a descendant issue entry for a review component."><figcaption><p>Screen scope is useful when you know a screen is broken but do not yet know which component is causing it.</p></figcaption></figure>

Use screen scope when you want a broader repair pass. At that level, Buzzy can offer fixes for all errors on the screen, all warnings on the screen, or a full cleanup across both.

## Guide the diagnosis with a short prompt

You do not need to type a prompt to use the debug tools, but a short prompt can help when the issue is ambiguous. For example:

* "Why is this review list empty?"
* "Check whether this button is wired to the wrong screen."
* "Find out why this form does not submit."

Keep the prompt short and focused on the visible problem. The selected screen or node provides most of the technical context automatically.

The debug agent is strongest when the selected node or screen is clearly related to the visible issue and the cause is present in the current structure, binding, or runtime context. It is less reliable for problems driven by external services, live data quality, or causes far away from the current screen. If the first diagnosis is too broad, change the selection and run it again.

## Reading the Debug tab

The exact sections vary by context, but the Debug tab can include:

* **Selection**: what is currently selected and how Buzzy is interpreting it
* **Data binding**: which table, field, or row context the node is using
* **Issues**: current-selection issues plus descendant issues
* **Visibility and display**: conditions that affect whether something appears
* **Runtime context**: context such as route, row, or surrounding view state
* **Row data** or **Table fields**: extra data context when Buzzy can infer it

Issue severity is grouped as:

* **Info**: useful context or a condition to be aware of
* **Warning**: something looks suspicious and may cause a problem
* **Error**: Buzzy found a concrete misconfiguration or broken dependency

## Focused selection in repeating content

When you click inside repeating content such as a list, table, or sub-table view, Buzzy tries to select the focused rendered instance you actually clicked. This is important because repeated layouts often share one design definition but render many rows.

That focused selection helps the Debug tab give more precise context for:

* the active row
* the bound field or view
* where a repeated child sits inside its parent data structure

## Read diagnosis results

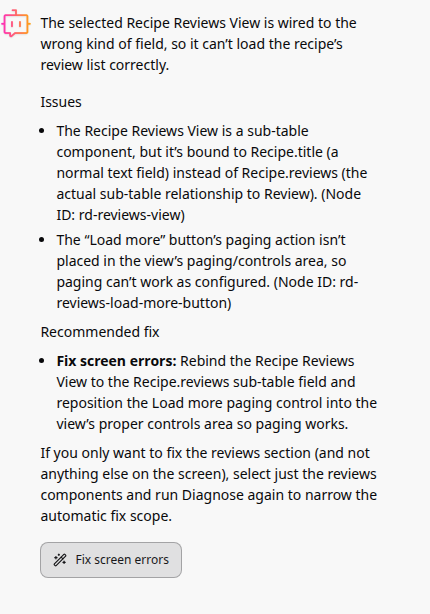
After you click **Diagnose with AI**, the AI panel returns a structured diagnosis. This usually includes:

* the main issues Buzzy found
* a plain-language explanation of what those issues mean
* one or more recommended fixes
* a fix button when Buzzy can offer an autofix

<figure><img src="/files/1bmVlqimgrexELEqWTKj" alt="AI chat panel showing a diagnosis with issues listed, a recommended fix, and a fix button."><figcaption><p>The diagnosis explains what Buzzy found before you decide whether to run an autofix.</p></figcaption></figure>

## Using autofix safely

Autofix can be used broadly or narrowly depending on what you want to change. You can fix all of the errors on a screen in one run, or you can select one area first if you want a more cautious, smaller-scope change.

Before you click a fix button:

1. Check that the diagnosis matches the issue you are trying to solve.
2. Make sure the selection or screen scope is correct.
3. Choose the full-screen fix if you want Buzzy to clean up everything in scope, or choose the narrower fix if you want to limit the changes to one part of the screen.

Autofix recommendations are usually narrow and concrete. They commonly focus on things like reconnecting a binding to the right field type, fixing a broken screen or action reference, or moving a control back into the view context it needs.

After the fix runs, re-open the Debug tab and confirm that the error count has dropped or the original issue has disappeared.

## Verifying the result

After any diagnosis or autofix:

1. Re-check the affected screen in **Preview**.
2. Return to **Edit** mode and inspect the same node again.
3. Confirm the Debug tab no longer shows the original error.
4. Test the real workflow that was failing, such as opening the view, submitting the form, or using the button.

If you need a reference for the individual Debug sections and common issue types, see the [In-App Debugging](/troubleshooting/in-app-debugging.md).